Many people are interesting in looking at excess deaths these days, and for the past 10 months I've seen numerous people in social media and blog posts saying that USA life insurance data demonstrate alarmingly high excess deaths in young adults in late summer/early fall 2021, claiming that given it is in young people whom they claim have "negligible" risk of COVID-19 death, that the natural explanation for these excess deaths was vaccine-caused deaths from the back-to-school vaccine mandates imposed on high school and college students.
Just this month, the Society of Actuaries (SOA) research institute has released a new report on excess death claims from group life insurance policies during the pandemic.
This report is the most recent on the basis of a survey of death claims data from 20 of the top 21 USA Group Term Life insurers comprising more than 2.3 millions claims to gather a high-level view of USA Group Term Life Insurance mortality results during the pandemic.
This report updates an initial report on this survey published in January 2022 whose scope was only from April, 2020 through September 1, 2021, the midst of the Delta surge in the USA, to include the 6 months from September 2022 through March 2022, which includes the end of the Delta surge and the winter Omicron surge.
They determined baseline mortality rates based on exposures and deaths during the 3-year period 2017-2019.
In this blog post I will simply highlight the key results of the report, which demonstrate that
There was indeed massive increase of excess death claims in young and middle age adults in Fall 2021
But the vast majority of these deaths were COVID-19 related deaths during the massive COVID-19 surge at that time.
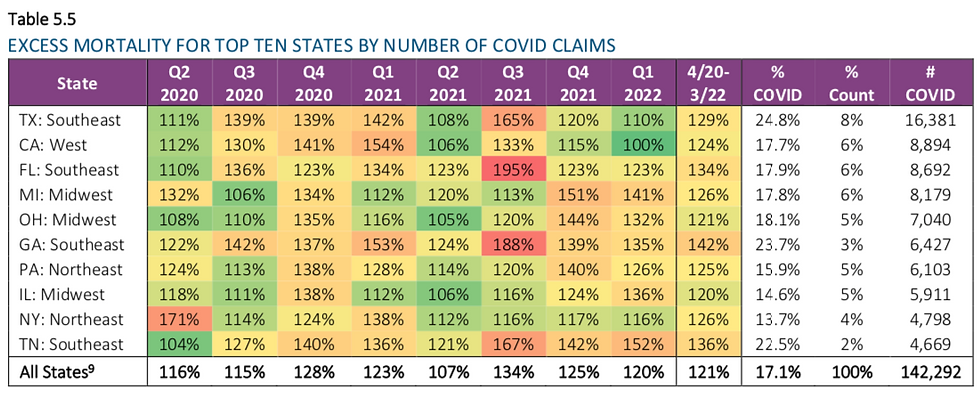
The excess deaths were primarily in the Southeastern USA that was hardest hit by the Delta wave, including Florida, Georgia, Texas, and Tennessee (who incidentally had relatively low vaccination rates in young and middle age adults)
There is no evidence of any connection to vaccination.
These conclusions are also apparent when looking at the CDC excess deaths data over time in which the spikes of excess deaths occur during COVID surge periods with high numbers of COVID-19 attributed deaths.
At the end of this blog post I respond to an ad hominem attack against me in another blog post discussing these same report.
In their report, they summarize their results in 3 ways:
Count-Based Reported claims: summarizes the number of claims filed in a given time period. This is by far the most objective, but not necessarily the most meaningful, since filing date can be some time after the actual death occurred.
Amount-Based Reported claims: this measure weights the larger policies more heavily, which may make older and more wealthy individuals count more in the given data set.
Count-Based Incurred claims: this measure aggregates the claims based on the death date, not the filing date. This is the most relevant measure, but suffers from underreporting bias in the most recent months since a certain percentage of deaths occurring during that time may not have yet been reported at the time of the analysis. As a result, historical data are used to estimate and impute the undercount, which adds an element of uncertainty and measurement error to these numbers.
Amount-Based Incurred claims: this measure weights the larger policies more heavily, which may make older and more wealthy individuals count more in the given data set.
In this blog post, I will focus on the Count-Based Incurred results, but one can access the report in the link above to see summaries based on other measures.
As mentioned, this report includes 20 carriers, and as pointed out on page 29 of the January 2022 release of this report, the carriers did not all attribute COVID-19 in the same way:

This emphasizes the uncertain nature of COVID-19 death attribution. Reflecting the broader community, some carriers considered COVID-19 was listed as a primary or secondary cause of death, one only classified as COVID-19 if it was identified as the primary cause of death on the death certificate, and the others did extensive research to decide COVID-19 attribution based on all available information. Given the uncertainty, it is always possible (and likely) that some deaths are attributed to COVID-19 for which it was not the major factor, and in other cases deaths that were in fact due to COVID-19 were not attributed as such.
Main Results
Here is a summary of the results to date split out by quarter.

We see that throughout the pandemic, there is a ~20% increase in group term life insurance claims, and this has remained relatively constant from 2020 to 2021 to 2022.
We see that the vast majority of excess death claims listed Covid-19 as a cause of death on the claims, accounting for 75-80% of the reported excess claims. The COVID-19 related death claims represented 16.6% excess over baseline during the entire pandemic period, 14.7% in 2020, 18.4% in 2021, and 15.5% so far in 2022.
But COVID-19 did not account for all of the excess claims. There were also excess death claims that were not listed as COVID based, but their magnitude only indicated 4.3% above baseline levels, 5.1% for 2020, 3.6% for 2021, and 4.4% so far in 2022. It is not clear whether pull forward effects (PFE) were taken into account in computing the baselines, so these numbers might be nominally higher if this factor were taken into account.
If we look at the much-discussed 3rd quarter of 2021 (July-September), indeed tis period has the highest rate of excess death claims so far in the pandemic, with a 33.7% excess comprised of a 25.0% increase in COVID-19 related claims plus an 8.7% increase in claims for which COVID-19 was not linked.
Regional Effects As I have mentioned before, this quarter is the heart of the Delta COVID-19 surge that hit the southeastern USA particularly hard. Here is a plot of daily new confirmed COVID-19 deaths in the USA over time, in which you can see the spikes corresponding to the key viral waves, for which the summer waves more heavily affected the southern USA and the winter waves more heavily affected the northern USA and midwest.

Indeed, we can see in the report that geographic regionswith the highest excess mortality in each quarter were the regions with the most intense COVID-19 surge during that quarter.

Note that the 3Q2021 with the highest excess claims of the pandemic was dominated by the southeastern region of the USA which was hardest hit by the Delta wave during that time. Table 5.5 split into the key states in those regions, and we can see that the 3Q2021 excess deaths were by far the worst in Florida, Georgia, Tennessee, and Texas. We also see how the 2Q2020 was dominated by NY, as expected.

One might also note that in this list, the states with the highest levels of excess death claims during the pandemic (Georgia, Tennessee, Florida, and Texas) tended to have lower than average vaccination rates.
Their report even presented scatterplots of state-level excess mortality estimates vs. vaccination rates to demonstrate a negative association. But as I have emphasized ad nauseam on social media and in recent blog posts (e.g. this one looking at CDC state level excess deaths vs. vaccination rates), trying to infer vaccine effects from group-level associations like this is an example of the ecological fallacy, trying to infer individual level associations (e.g. risk of death and vaccination status of an individual) from group-level associations (e.g. state-level excess death and vaccination rates) which cannot be reliably done because of key state-level confounding factors associated with both death risk and propensity to vaccinate, including socioeconomic status, population density, age demographics, mitigation strategies, healthcare system robustness, attitudes towards healthcare, mitigation, and the pandemic, and other factors that might partially explain any such association beyond any causal vaccine effects.
That is why I repeatedly emphasize that the only way to reliably estimate vaccine effects from observational data is from individual-level data split out by vaccination status and adjusting for key confounders through modeling or design.
While vaccination rate may certainly be a key factor in explaining the excess death claims for a given state relative to another, the inability to parse out this factor from the other confounders makes this an inadvisable and easily misinterpreted enterprise.
Age Effects
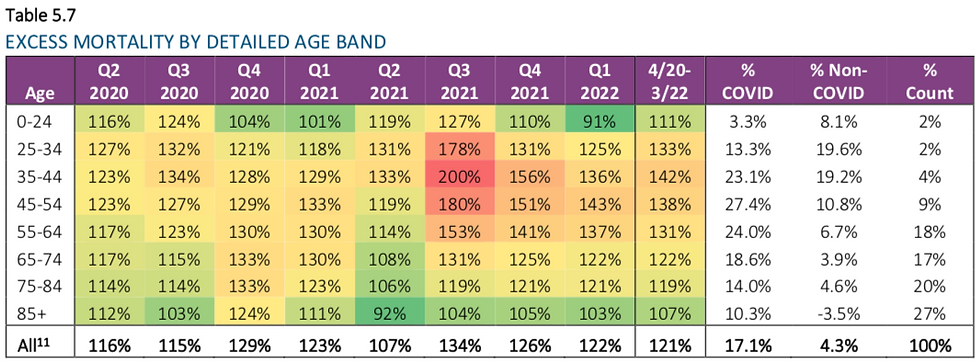
We also see major age effects in the SOA data. Here are the excess deaths split out by age group for each quarter.

While of course the raw number of deaths and excess deaths are highest in the oldest age groups, the relative increase in excess death claims is highest in the younger age groups, which is especially apparent in the 3Q2021 period, in which the 0-44yr age group is 79% above baseline and 45-64yr is 62% above baseline. When broken down in finer age groups, you can see that the young middle-age group 35-44yr has the highest excess deaths during this time (double baseline rate), while the slightly older (45-54yr, 80% excess) and slightly younger (25-34yr, 78% excess) are almost as high.

Many of the social media reports decrying the excess deaths in young people are based on 18-44yr or 18-64yr, but we can see that the worst excess at least in terms of death claims is in the middle age groups 25-54yr old.
From previous charts, we can see that the vast majority of these death claims are COVID-19 attributed, and the lion's share is located in the southeastern USA that was hardest hit by the Delta surge in 3Q2021.
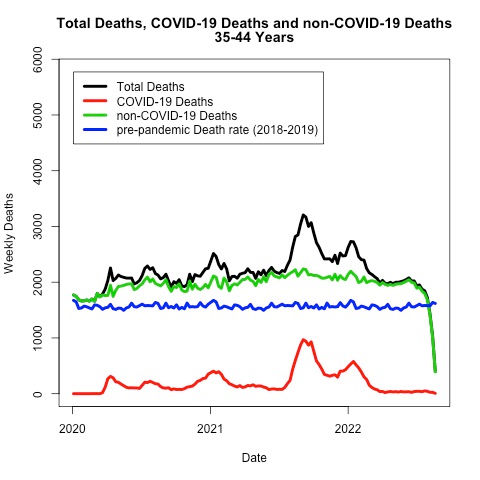
This agrees with the COVID-19, all-cause, and non-COVID-19 provisional death counts publicly posted on the CDC dashboard throughout the pandemic, in which the spikes of deaths correspond to waves of COVID-19 deaths at various times throughout the pandemic.


It is good to see that the SOA insurance data and CDC data are concordant on these matters. Compared with a simple 2018-2019 seasonal baseline, we see that the major excess deaths in the CDC data are COVID-19 deaths during the major viral waves, although just like in the SOA data there are some additional excess deaths that are not COVID-19 attributed as well. In the CDC data just as in the SOA data, these are present throughout the pandemic, not just after vaccination rollout. Thus, these data do not provide support for the notion that the vaccines are a major contributing factor to excess deaths, although as I have emphasized many times any reasonable assessment of vaccine effects must be done in studies based on individual data split by vaccination status and adjusting for key confounders.
Causes of Death and Unknown Causes
Note that the SOA report partitioned the cause of death for each quarter between COVID-19, accident, illness, or "unknown"

Note that 1Q2022 has a high proportion of death claims with unknown causes. The provisional nature of the incurred counts means that the most recent period will always tend to have more unknown causes since imputation is required to estimate the unreported death claims, whose causes will of course be unknown. This is easily seen in this analogous plot from the previously released report for which the 3Q2021 period required high levels of imputation and thus high numbers of death claims of unknown cause.

The later release with updated data reassigned most of these "unknown" deaths to the appropriate category, which is natural since the later releases provide completely real and not imputed data for those time points.
Response to ad hominem attacks directed towards me in another blog post on this topic
A blog post released just today in the Rounding the Earth Newsletter my Mathew Crawford made a big deal about the "unknown" category in the 3Q2021 plot of the January 2022 report being "fanned out" into other categories, including COVID-19, implying something nefarious may be going on. Apparently he didn't realize or acknowledge the provisional nature of the incurred data requires imputation of presumed underreported death claims in the most recent quarter, for which of course there would be no cause known yet since they are hypothetical deaths.
Incidentally, the same blog post also makes a big deal poking at the state-level excess deaths vs. vaccination rate scatterplots I critique above, emphasizing that there may be a "Simpson's paradox" effect caused by state-level confounding factors (such as region) that could obscure their interpretation. His points are legitimate, and I heartily agree with them as is evident by my own ad nauseam critiques of these types of ecological fallacy-based misguided attempts to make statements about vaccine effects from scatterplots.
I will comment a little more on his blog post since he takes an entire paragraph in his blog to include a misguided ad hominem attack against me based on false pretenses.
As you may know, on social media and in this blog I have pointed out several prominent cases in which Simpson's paradox in the pandemic has led to confusion and misleading claims not just from an anti-vaccine (here and here and here) perspective but also from the pro-vaccine perspective (here). Labelling me a "pro-narrative" biostatistician, he attacks me suggesting I "missed" this potential incident of Simpson's paradox, of course ignoring my ad nauseam efforts to warn others in their misguided attempts to try to infer causal vaccine effects from such group-level scatterplots, as Mathew Crawford has repeatedly done countless times throughout the pandemic in the COVID-19 vaccine related posts in his "Rounding the Earth" newsletter (which can be clearly seen if you look back on his old archives).
Further, he claims falsely that I "bragged to him that I had several dozen biostatisticians working under me" and implies I must not be employing them properly to miss this egregious example of Simpson's paradox, and then puts in some dig about Pfizer.
As I have emphasized repeatedly, my COVID-19 work on social media and in this blog is done solely by me in my free time, with no compensation directly or indirectly from Pfizer or anyone else, outside of my primary professorial job that includes teaching, advising trainees, research (almost all unrelated to COVID-19), and administrative leadership position as division director over a group of 35 Biostatistics professors.
These professors have their own research programs that I have not control over, I am simply their supervisor and leader supporting them in their research careers -- None of them are "under" me, I don't employ them on my own research projects, and they do not work with me on any of this COVID-19 blog and social media efforts. I also have a team of graduate students and postdoctoral researchers who are doing research "under" my direction, but I also don't employ them in these social media/blog efforts, since I don't think fighting with people like Mathew Crawford and others is as beneficial for their career as the substantive scientific projections on which we are working together.
Mathew and I have a history, starting with my initial blog post pointing out the extreme scientific flaws in Steve Kirsch's document "supporting" his claims that spike is toxic and killing many people. After this, I engaged with numerous members of Kirsch's "team" who were trying to respond to my blog post. I engaged them in good faith, but was honestly worn out after several hours of back and forth when Mathew jumped in trying to argue that the vaccines were causing the mutations directly leading to the new variants, a point with which I disagreed. When he offered to "walk me through the calculations," I brushed him off saying "I am a Biostatistics professor" implying I didn't want to take the time with him (as I was already worn out and wanting to get back to my real job and wasn't sure he realized I had experience in statistical genetics). Since Mathew is a very smart person who has done a lot of modeling and teaching of computational genetics but does not have a degree in Biostatistics or related field, this apparently struck him as elitist, he was offended and has been actively hostile to me ever since. I apologized but he had no interest in accepting my apology. I regret I didn't just tell him I'd be glad to listen to his argument at a later time, but given how reactive he was and how he has behaved towards me since then, I'm not sure it would have made our subsequent interactions any more cordial.

The USA Group Term Life Insurance Report highlighted a rise in young adult excess deaths in Fall 2021, raising concerns about unforeseen risks. Just like in CarX Street Drive, where unexpected crashes can end a race, real-life uncertainties emphasize the need for protection—whether through insurance or safer driving habits.
The USA Group Term Life Insurance Report highlighted a concerning rise in young adult excess deaths in Fall 2021, attributed to factors like COVID-19 and lifestyle risks. For beach buggy racing enthusiasts, this underscores the importance of safety measures, proper training, and health awareness to mitigate risks while enjoying the sport's thrills.
This post is really great, wow. I thought your information was very helpful and useful. Don't stop telling people good things. Thanks for the great articles on your site. I have saved it for future use. foodle
Indulge in a luxurious and premium experience with trusted professionals who prioritize your satisfaction. We offer a safe, smooth, and highly professional service with secure payment options. Contact us now to book Aerocity Escort Service your exclusive session!
replica watches
replica breitling